Hypothetical protein Method: Difference between revisions
No edit summary |
|||
| (10 intermediate revisions by 4 users not shown) | |||
| Line 1: | Line 1: | ||
=='''Evolution'''== | |||
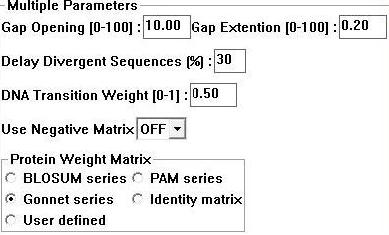
Sequences for evolutionary analysis were gathered from NCBI using BLASTP (refseq). These were selected from different phyla on the basis of sequence identity (>30%). More distantly related sequences were obtained using the Psi-BLAST algorithm available at Interpro. Selected sequences were gathered in FASTA format and input into a .txt file [http://compbio.chemistry.uq.edu.au/mediawiki/upload/c/c0/Fewerseqforalign.txt]sequentially. ClustalX 1.83 [1] was then used to generate a multiple sequence alignment for the above sequences using the following parameters; | |||
[[Image:clus.jpg]] | |||
'''Figure 1:''' Clustalx 1.83 alignment parameters [1] | |||
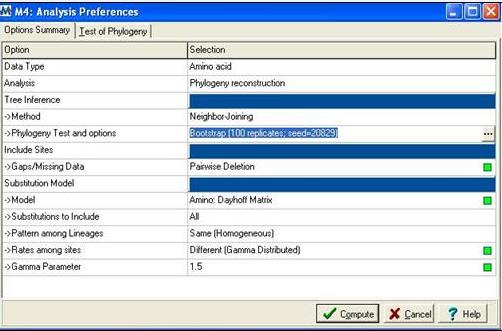
Following alignment; sequences were trimmed in Clustalx [1] from residues 31-184 to remove extending ‘tails’ for more accurate phylogenetic analysis. The alignment file was then saved as an .aln file and exported to MEGA 4.0 [2] using the program’s conversion to MEGA format tool. MEGA [2] was then used to construct a bootstrapped neighbour joining tree using the following parameters; | |||
[[Image:mega.jpg]] | |||
'''Figure 2:''' Mega alignment parameters [2], Gamma parameter was established using Quartet puzzling [3]. | |||
A bootstrapped tree representing radiation was then copied to Microsoft power point 2007 to emphasise key features and significant bootstrap values. | |||
=='''Structure'''== | |||
Initial structural alignments were conducted via a Dali search (Holm & Sander 1993). The two highest unique hits in the search were chosen for further analysis. | |||
Crystallographic structures of the three proteins were downloaded from the PDB (RCSB 2008) and visualised in VMD (Humphrey 1996). Some additional preliminary information was also gathered from the PDB. Using the MultiSeq extension for VMD (Roberts et al. 2006), the structures were aligned in 3D. The PDBSum database (EMBL-EBI 2008) was used to obtain secondary structure schematics and gave access to a LIGPLOT analysis of ligand-binding residues (Wallace et al. 1995). | |||
PFAM (Sanger Institute, 2001) and SCOP (Murzin et al. 1995) classifications were acccessed for the target protein and its domain architecture determined via these tools. Additionally, the PQS tool (EMBL-EBi 2008) was consulted via PDBSum to check predicted quaternary structures of the two matching proteins. | |||
Literature sources were consulted to confirm conclusions throughout this process. However, this was limited by the minimal available information on these structures; all bar 1ogD remain unpublished. | |||
As it became clear that ligand binding required coordination between multiple subunits, copies of 1ogD and 2ob5 were added to the Multiseq alignment and aligned with corresponding regions of 3e7n and 1ogD, respectively, to manually simulate higher-order oligomers. | |||
Extensive visual analysis was conducted in VMD against the MultiSeq alignment and residue-conservation information, in order to identify locations of key binding residues in each protein. Conclusions were drawn from representations of binding residues, surfaces and multi-subunit arrangements, as outlined in the results section. | |||
The CASTp database was searched by PDBid to identify high surface area binding clefts in the protein (Dundas et al. 2006). CASTp results were compared against the visual VMD/Multiseq alignment and conclusions drawn from this. | |||
The LPC database was also consulted to better characterise interacting residues at the ion coordination site, and this information was used to subsequently expand visual analysis of the ion cage region (Sobolev et al. 1999). | |||
=='''Function'''== | |||
The main methods for the function of our protein involved the use of STRING analysis and Profunc analysis. This involved the submitting of our protein to the respective services, after which they provided their separate anaylsis of the specified protein. Literature was used to confirm any speculations garnished from the results obtained. | |||
[[Hypothetical protein Abstract | Abstract ]] | [[Hypothetical protein Introduction | Introduction]] | [[Hypothetical protein Method| Method]] | | [[Hypothetical protein Abstract | Abstract ]] | [[Hypothetical protein Introduction | Introduction]] | [[Hypothetical protein Method| Method]] | | ||
[[Hypothetical protein Results | Results]] | [[Hypothetical protein Discussion | Discussion]] | [[Hypothetical protein Conclusion | Conclusion ]] | [[Hypothetical protein References | References ]]<BR> | [[Hypothetical protein Results | Results]] | [[Hypothetical protein Discussion | Discussion]] | [[Hypothetical protein Conclusion | Conclusion ]] | [[Hypothetical protein References | References ]]<BR> | ||
[[hypothetical protein LOC282969 isoform 1 | Go Back To Main Page]] | [[hypothetical protein LOC282969 isoform 1 | Go Back To Main Page]] | ||
Latest revision as of 01:08, 16 June 2009
Evolution
Sequences for evolutionary analysis were gathered from NCBI using BLASTP (refseq). These were selected from different phyla on the basis of sequence identity (>30%). More distantly related sequences were obtained using the Psi-BLAST algorithm available at Interpro. Selected sequences were gathered in FASTA format and input into a .txt file [1]sequentially. ClustalX 1.83 [1] was then used to generate a multiple sequence alignment for the above sequences using the following parameters;
Figure 1: Clustalx 1.83 alignment parameters [1]
Following alignment; sequences were trimmed in Clustalx [1] from residues 31-184 to remove extending ‘tails’ for more accurate phylogenetic analysis. The alignment file was then saved as an .aln file and exported to MEGA 4.0 [2] using the program’s conversion to MEGA format tool. MEGA [2] was then used to construct a bootstrapped neighbour joining tree using the following parameters;
Figure 2: Mega alignment parameters [2], Gamma parameter was established using Quartet puzzling [3].
A bootstrapped tree representing radiation was then copied to Microsoft power point 2007 to emphasise key features and significant bootstrap values.
Structure
Initial structural alignments were conducted via a Dali search (Holm & Sander 1993). The two highest unique hits in the search were chosen for further analysis.
Crystallographic structures of the three proteins were downloaded from the PDB (RCSB 2008) and visualised in VMD (Humphrey 1996). Some additional preliminary information was also gathered from the PDB. Using the MultiSeq extension for VMD (Roberts et al. 2006), the structures were aligned in 3D. The PDBSum database (EMBL-EBI 2008) was used to obtain secondary structure schematics and gave access to a LIGPLOT analysis of ligand-binding residues (Wallace et al. 1995).
PFAM (Sanger Institute, 2001) and SCOP (Murzin et al. 1995) classifications were acccessed for the target protein and its domain architecture determined via these tools. Additionally, the PQS tool (EMBL-EBi 2008) was consulted via PDBSum to check predicted quaternary structures of the two matching proteins.
Literature sources were consulted to confirm conclusions throughout this process. However, this was limited by the minimal available information on these structures; all bar 1ogD remain unpublished.
As it became clear that ligand binding required coordination between multiple subunits, copies of 1ogD and 2ob5 were added to the Multiseq alignment and aligned with corresponding regions of 3e7n and 1ogD, respectively, to manually simulate higher-order oligomers.
Extensive visual analysis was conducted in VMD against the MultiSeq alignment and residue-conservation information, in order to identify locations of key binding residues in each protein. Conclusions were drawn from representations of binding residues, surfaces and multi-subunit arrangements, as outlined in the results section.
The CASTp database was searched by PDBid to identify high surface area binding clefts in the protein (Dundas et al. 2006). CASTp results were compared against the visual VMD/Multiseq alignment and conclusions drawn from this.
The LPC database was also consulted to better characterise interacting residues at the ion coordination site, and this information was used to subsequently expand visual analysis of the ion cage region (Sobolev et al. 1999).
Function
The main methods for the function of our protein involved the use of STRING analysis and Profunc analysis. This involved the submitting of our protein to the respective services, after which they provided their separate anaylsis of the specified protein. Literature was used to confirm any speculations garnished from the results obtained.
Abstract | Introduction | Method |
Results | Discussion | Conclusion | References

