Methods 2ece: Difference between revisions
| Line 98: | Line 98: | ||
STRUCTURAL COMPARISONS | STRUCTURAL COMPARISONS | ||
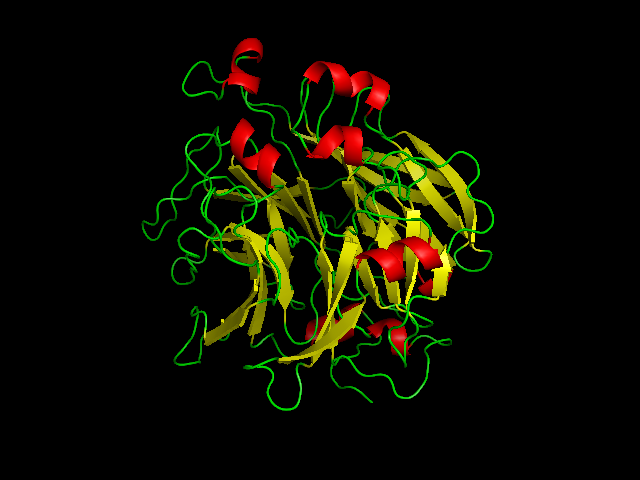
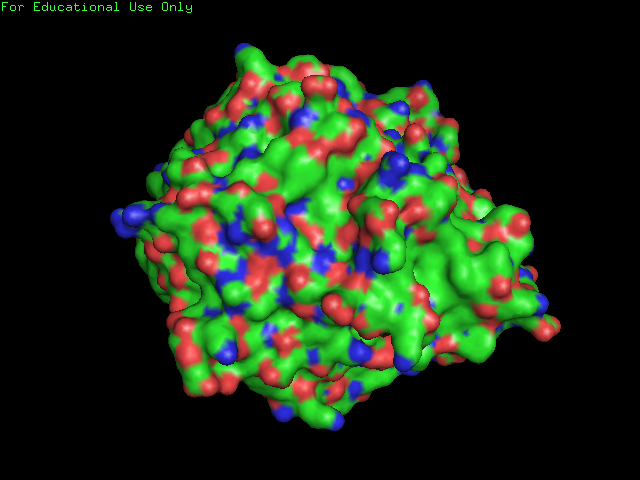
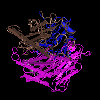
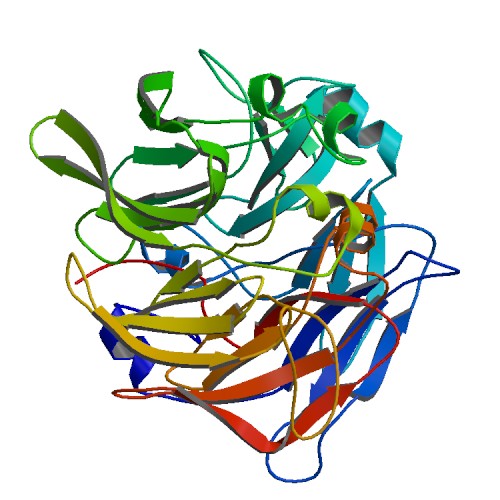
[[Image:surface of 2ece.png]] | [[Image:surface of 2ece.png|frame|border|left|'''Figure 7''' Surface Structure of SBP: Note the few clefts compared to the DNA isomerase shown below.]] | ||
[[Image:1YUA SURFACE STRUCTURE.JPG | |||
[[Image:1YUA SURFACE STRUCTURE.JPG|frame|border|left|'''Figure 8''' pdb (1yua)-Topo-Zn DNA isomerase surface structure] | |||
[http://www.ncbi.nlm.nih.gov/entrez/query/static/gifs/entrez_struc.gif] | [http://www.ncbi.nlm.nih.gov/entrez/query/static/gifs/entrez_struc.gif] | ||
Revision as of 07:39, 9 June 2008
STRUCTURAL ANALYSIS
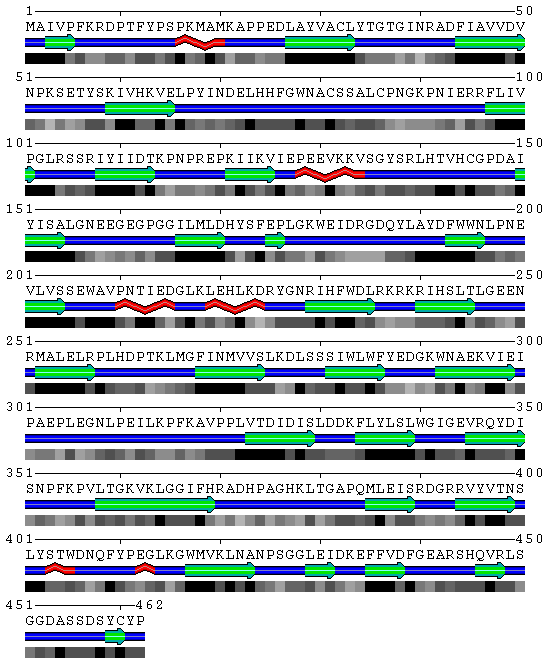
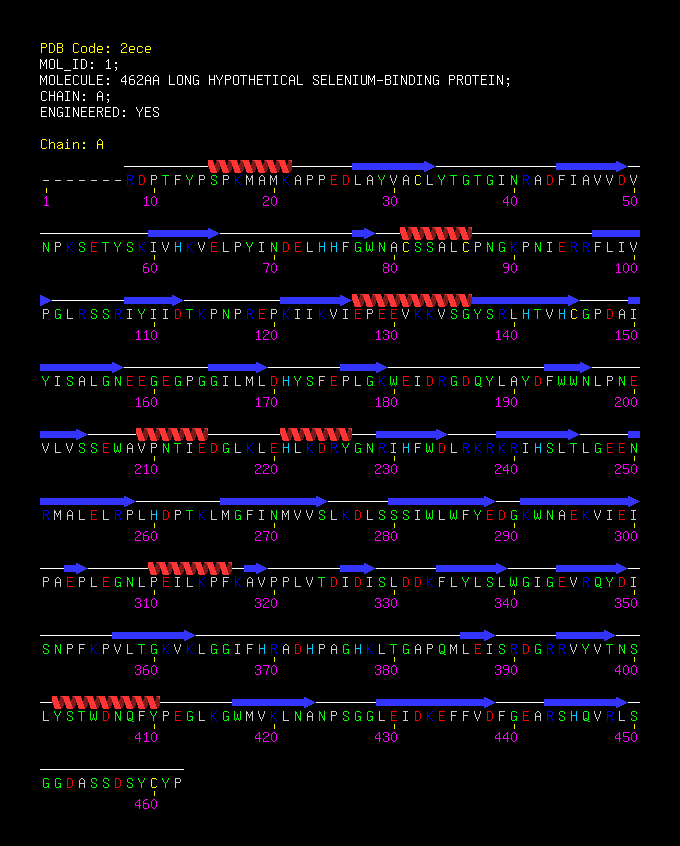
SBP 1 Amino Acid FASTA FORMAT Sequence
>2ECE:A|PDBID|CHAIN|SEQUENCE
MAIVPFKRDPTFYPSPKMAMKAPPEDLAYVACLYTGTGINRADFIAVVDVNPKSETYSKIVHKVELPYINDELHHFGWNA CSSALCPNGKPNIERRFLIVPGLRSSRIYIIDTKPNPREPKIIKVIEPEEVKKVSGYSRLHTVHCGPDAIYISALGNEEG EGPGGILMLDHYSFEPLGKWEIDRGDQYLAYDFWWNLPNEVLVSSEWAVPNTIEDGLKLEHLKDRYGNRIHFWDLRKRKR IHSLTLGEENRMALELRPLHDPTKLMGFINMVVSLKDLSSSIWLWFYEDGKWNAEKVIEIPAEPLEGNLPEILKPFKAVP PLVTDIDISLDDKFLYLSLWGIGEVRQYDISNPFKPVLTGKVKLGGIFHRADHPAGHKLTGAPQMLEISRDGRRVYVTNS LYSTWDNQFYPEGLKGWMVKLNANPSGGLEIDKEFFVDFGEARSHQVRLSGGDASSDSYCYP
WARNING! Given sequence appeared to be a soluble protein, no TM domains found!
Output format is the following:
1st line -> residue numeration
2nd line -> query amino acid sequence
3rd line -> trans-membrane domain prediction (T-TM region, N-soluble part)
     MAIVPFKRDPTFYPSPKMAMKAPPEDLAYVACLYTGTGINRADFIAVVDVNPKSETYSKI
    NNNNNNNNNNNNNNNNNNNNNNNNNNNNNNNNNNNNNNNNNNNNNNNNNNNNNNNNNNNNN

     VHKVELPYINDELHHFGWNACSSALCPNGKPNIERRFLIVPGLRSSRIYIIDTKPNPREP
     NNNNNNNNNNNNNNNNNNNNNNNNNNNNNNNNNNNNNNNNNNNNNNNNNNNNNNNNNNNN

     KIIKVIEPEEVKKVSGYSRLHTVHCGPDAIYISALGNEEGEGPGGILMLDHYSFEPLGKW
     NNNNNNNNNNNNNNNNNNNNNNNNNNNNNNNNNNNNNNNNNNNNNNNNNNNNNNNNNNNN

     EIDRGDQYLAYDFWWNLPNEVLVSSEWAVPNTIEDGLKLEHLKDRYGNRIHFWDLRKRKR
     NNNNNNNNNNNNNNNNNNNNNNNNNNNNNNNNNNNNNNNNNNNNNNNNNNNNNNNNNNNN

     IHSLTLGEENRMALELRPLHDPTKLMGFINMVVSLKDLSSSIWLWFYEDGKWNAEKVIEI
     NNNNNNNNNNNNNNNNNNNNNNNNNNNNNNNNNNNNNNNNNNNNNNNNNNNNNNNNNNNN

     PAEPLEGNLPEILKPFKAVPPLVTDIDISLDDKFLYLSLWGIGEVRQYDISNPFKPVLTG
     NNNNNNNNNNNNNNNNNNNNNNNNNNNNNNNNNNNNNNNNNNNNNNNNNNNNNNNNNNNN

     KVKLGGIFHRADHPAGHKLTGAPQMLEISRDGRRVYVTNSLYSTWDNQFYPEGLKGWMVK
     NNNNNNNNNNNNNNNNNNNNNNNNNNNNNNNNNNNNNNNNNNNNNNNNNNNNNNNNNNNN

     LNANPSGGLEIDKEFFVDFGEARSHQVRLSGGDASSDSYCYP
     NNNNNNNNNNNNNNNNNNNNNNNNNNNNNNNNNNNNNNNNNN
Figure 3 SABLE server results.
STRUCTURAL COMPARISONS
[[Image:1YUA SURFACE STRUCTURE.JPG|frame|border|left|Figure 8 pdb (1yua)-Topo-Zn DNA isomerase surface structure]
Rat fatty acid binding protein 2IFB, a was found to have 92.5% homology to 14 KDa Selenium binding protein purified from rat liver using column chromatography and SDS-Gel techniques.([ref 3])
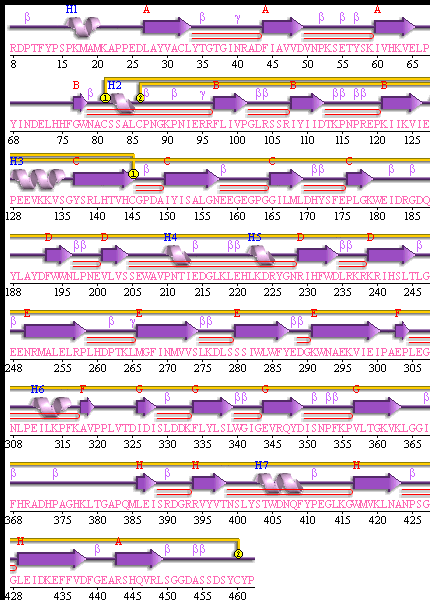
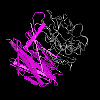
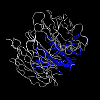
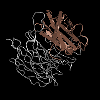
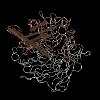
Explore SBP features and structural summary here [2].The domains of SBP are shown here [3] Notice how the domains are similar to the putative Isomerase domains of E.coli below.
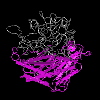
1RI6 DOMAINS
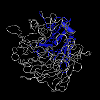
2ECE DOMAINS
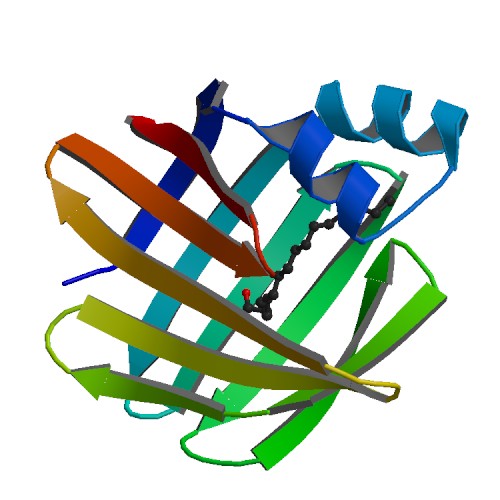
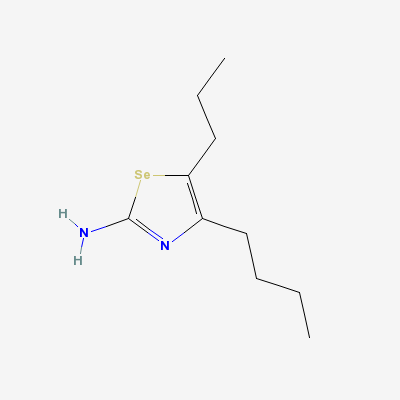
(Complex Of Bovine Odorant Binding Protein (Obp) With A Selenium Containing Odorant)"Image:Ligand of bovine.png" [[4]]
SEQUENCE ANALYSIS
Selenium binding protein 1 (SELENBP1) SELECTED PROTEIN SIMILARITIES Comparison of sequences in UniGene with selected protein reference sequences. The alignments can suggest function of a gene. [5]
