Results - 2gqnA: Difference between revisions
(→Tree) |
(→Tree) |
||
| Line 11: | Line 11: | ||
==Tree== | ==Tree== | ||
[[Image:Tree.PNG|framed|'''Figure '''<BR>A rooted bootstrap phylogenetic tree with 100 bootstrap trials viewed in <I>FigTree</I>. The asterik indicates branches with low bootstrap value. This tree shows homologous sequences are from wide range of different organisms. <I>tRNA isopentenyl transferase 1 </I> is branched with the bacteria and surprisingly plasmodium is also from the same branch as bacteria. none]] | [[Image:Tree.PNG|framed|'''Figure 2'''<BR>A rooted bootstrap phylogenetic tree with 100 bootstrap trials viewed in <I>FigTree</I>. The asterik indicates branches with low bootstrap value. This tree shows homologous sequences are from wide range of different organisms. <I>tRNA isopentenyl transferase 1 </I> is branched with the bacteria and surprisingly plasmodium is also from the same branch as bacteria. none]] | ||
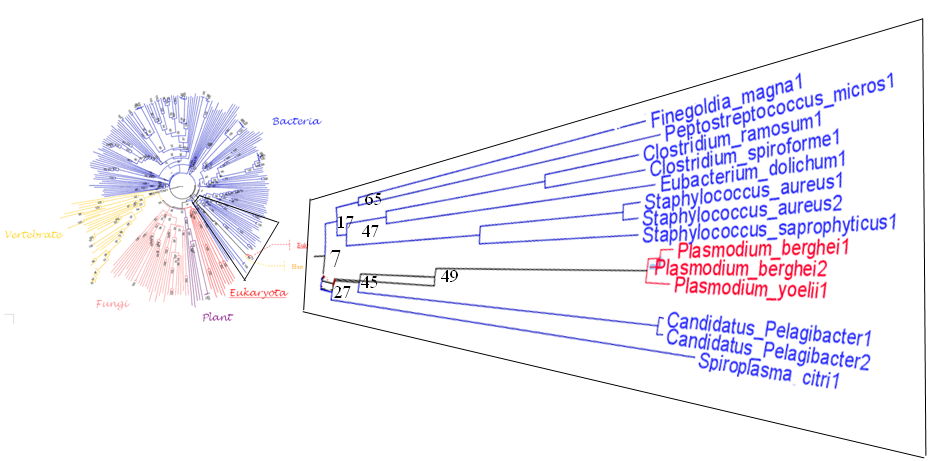
[[Image:plasm.png|framed|'''Figure '''<BR>This is a magnified version of | [[Image:plasm.png|framed|'''Figure 3'''<BR>This is a magnified version of <B>Figure</B> on <I>Plasmodium</I> with taxa name displayed. The values on the nodes indicate bootstrap values drawn from a phylogenetic tree with 100 bootstrap value. Node with no value represents high bootstrap value (>70).|none]] | ||
'''Treeview and multiview''' | '''Treeview and multiview''' | ||
Revision as of 12:10, 9 June 2008
Multiple Sequence Alignment
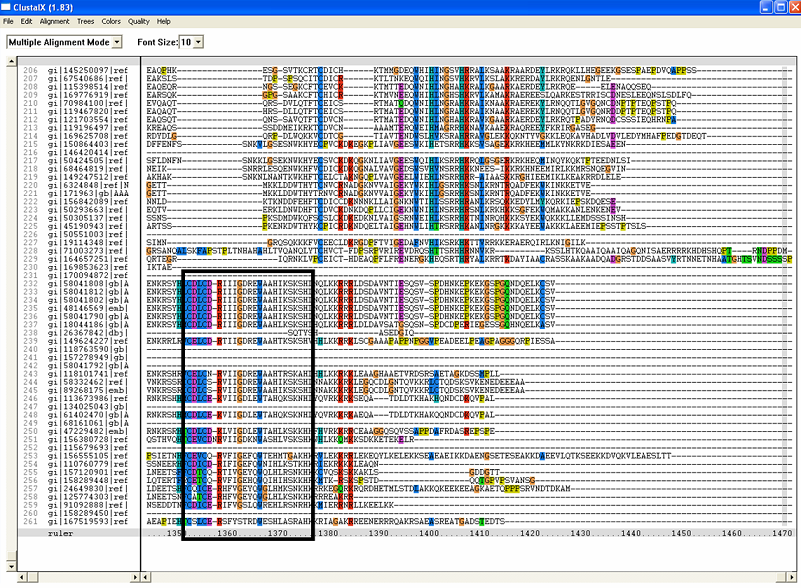
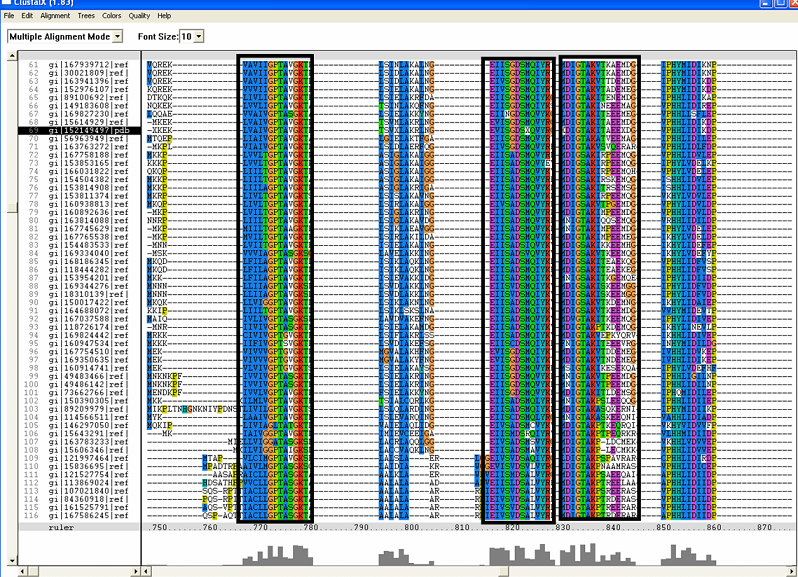
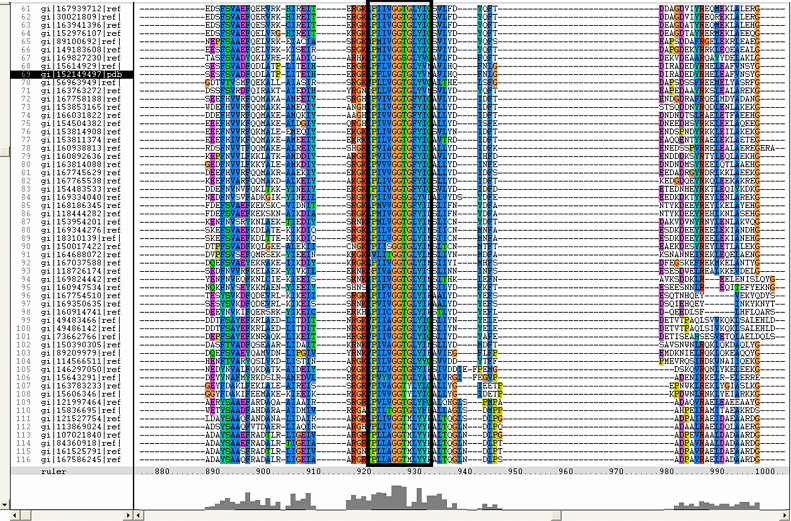
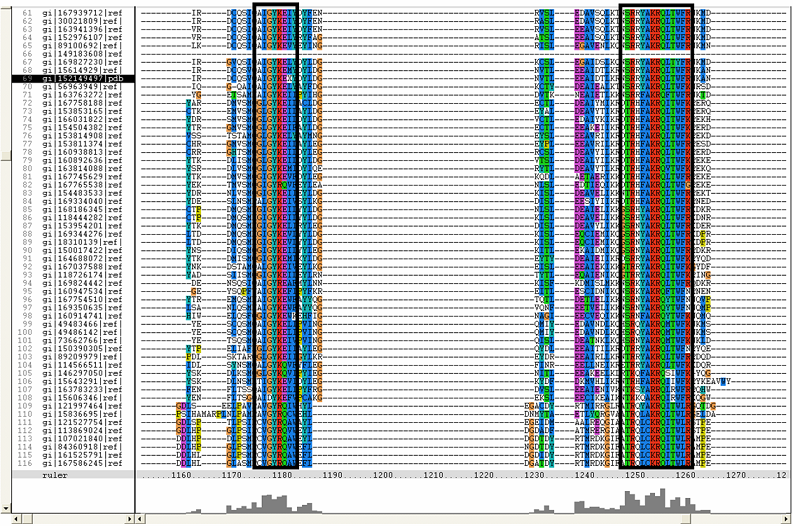
Figure :
Multiple sequence alignment with 260 homologous sequences and 2qgnA (tRNA isopentenyltransferase 1, 69th sequence which is highlighted on the right hand column) was constructed by ClustalX. Gaps are represented as ‘-‘. Orange, red, blue and green indicate residue code of “A”, “C”, “T” and “G” respectively (Kohli and Bachhawat 2003). Conserved regions are shown in the black box. (A) region from 750bp to 870 bps (B) region from 880bp to 1000bp (C) region from 1160bp to 1270bp (D)region on the c-terminus.
Tree
A rooted bootstrap phylogenetic tree with 100 bootstrap trials viewed in FigTree. The asterik indicates branches with low bootstrap value. This tree shows homologous sequences are from wide range of different organisms. tRNA isopentenyl transferase 1 is branched with the bacteria and surprisingly plasmodium is also from the same branch as bacteria. none
Treeview and multiview
Structure of tRNA isopentenyltransferase
Protein Sequence in FASTA format
>gi|152149497|pdb|2QGN|A Chain A, Crystal Structure Of Trna Isopentenylpyrophosphate Transferase (Bh2366) From Bacillus Halodurans, Northeast Structural Genomics Consortium Target Bhr41. XKEKLVAIVGPTAVGKTKTSVXLAKRLNGEVISGDSXQVYRGXDIGTAKITAEEXDGVPHHLIDIKDPSE SFSVADFQDLATPLITEIHERGRLPFLVGGTGLYVNAVIHQFNLGDIRADEDYRHELEAFVNSYGVQALH DKLSKIDPKAAAAIHPNNYRRVIRALEIIKLTGKTVTEQARHEEETPSPYNLVXIGLTXERDVLYDRINR RVDQXVEEGLIDEAKKLYDRGIRDCQSVQAIGYKEXYDYLDGNVTLEEAIDTLKRNSRRYAKRQLTWFRN KANVTWFDXTDVDFDKKIXEIHNFIAGKLEEKSKLEHHHHHH
Protein Structure
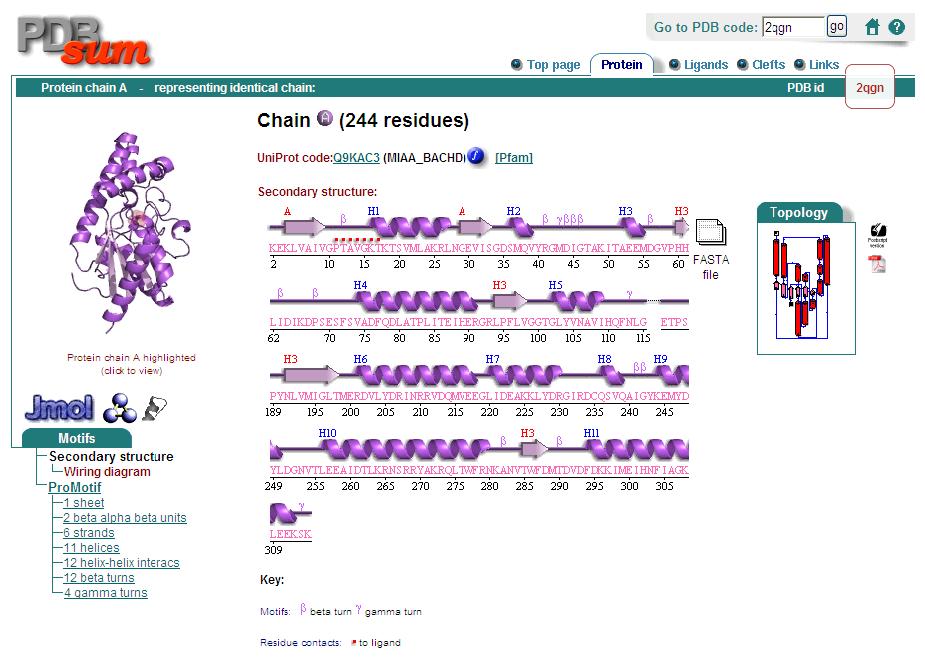
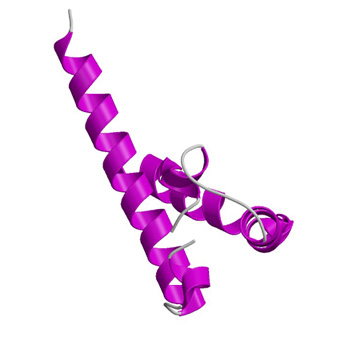
Secondary Structure
Analysis of the secondary structure acquired from Protein Data Bank showed results as displayed below :
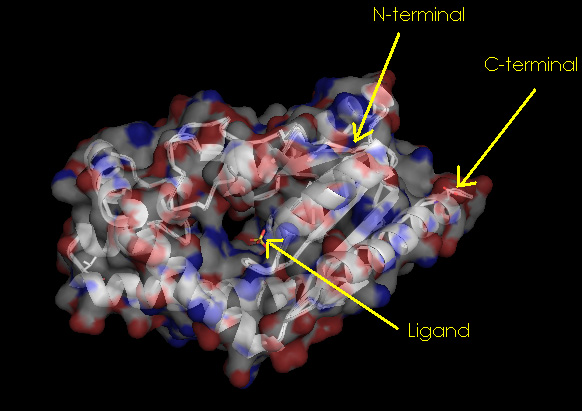
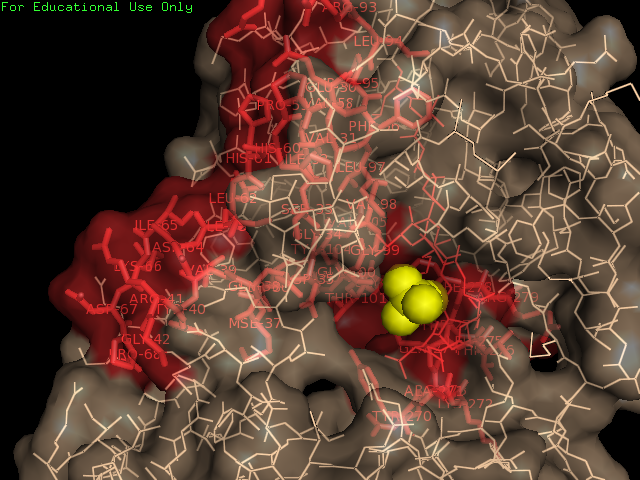
Surface Properties of 2qgn
Domains
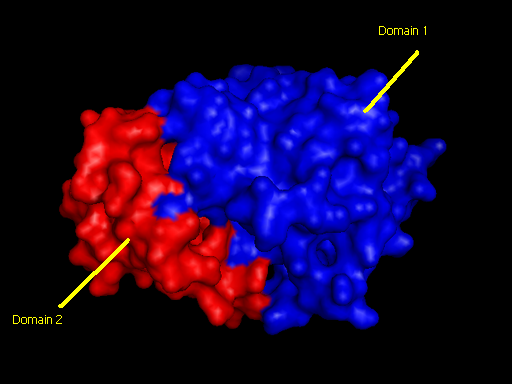
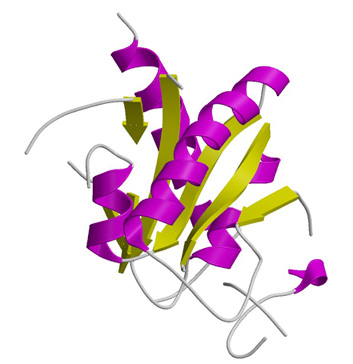
2qgnA is composed of two main domains. CATH analysis of 2qgn resulted in the finding of two main domains composing 2qgnA.
Domain 1 ranges from residue 2-200 and residue 283-314. Domain 2 encompasses residues stretching from 201-282.
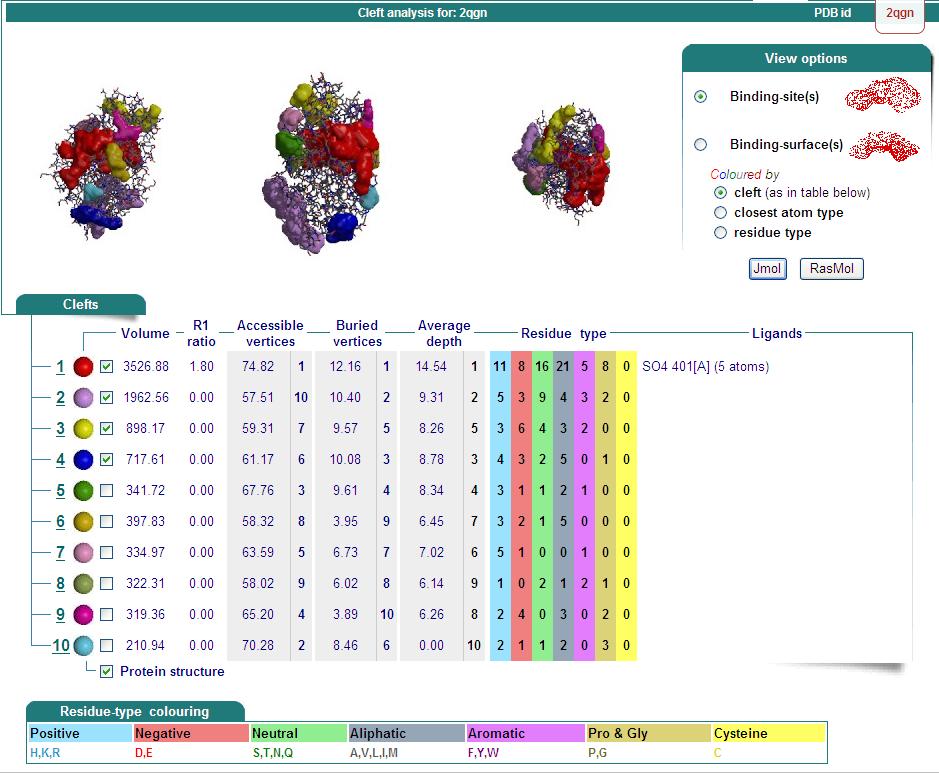
Ligand Binding Sites and Surface Clefts
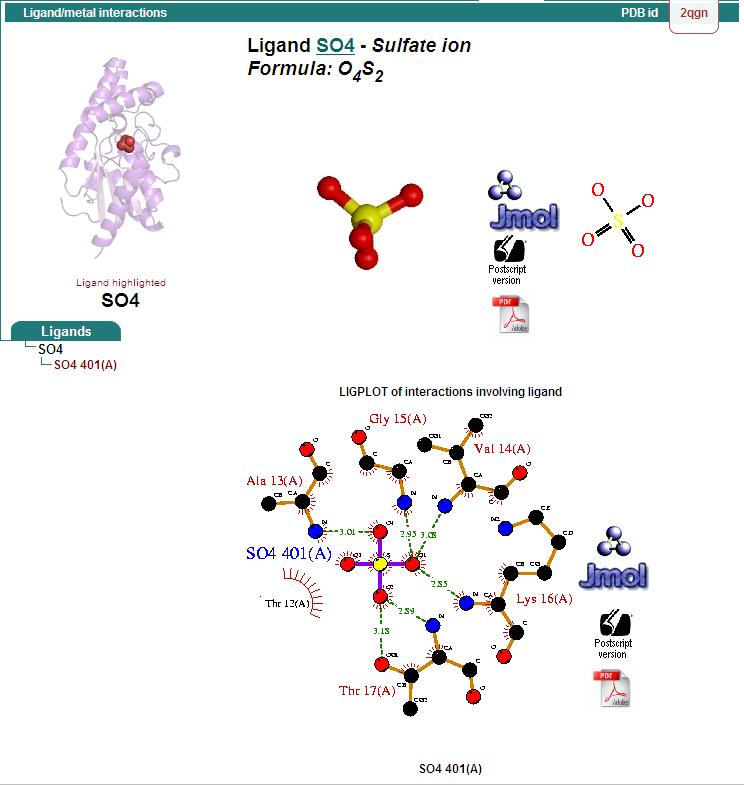
Protein-ligand interaction
Hydrophillic binding sites
Bridged-H-bond binding sites
Hydrophobic binding sites
Conserved residues for tRNA isopentenyl transferase from Clustal alignment
Multiple sequence alignment from ClustalX allowed conserved regions in 2qgn and related species to be found.
Structural Alignment
Dali Output
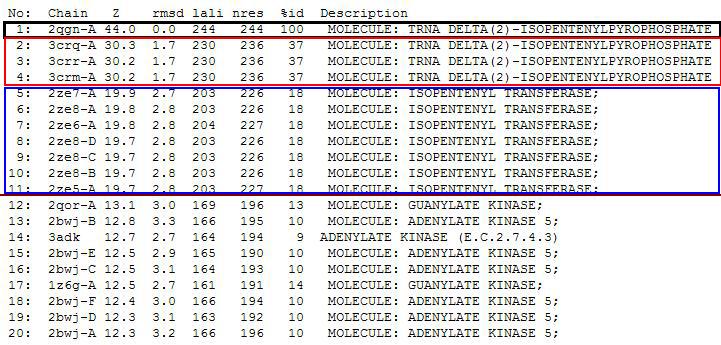
PDB entry code for 2qgn was loaded onto DALI server to search for structurally similar neighbours. Displayed below are the results from DALI search :-
DALI output describes the following :
Z score , the statistical significance of the similarity between protein-of-interest and other neighbourhood protines. The program optimises a weighted sum of similarities of intramolecular distances.
Root Mean Square Distance (RMSD), root-mean-square deviation of C-alpha atoms in the least-squares superimposition of the structurally equivalent C-alpha atoms. As in indicated in DALI, rmsd is not optimised and is only reported for information.
lali, the number of structurally equivalent residues.
nres, or the total number of amino acids in the hit protein.
%id - percentage of identical amino acids over structurally equivalent residues.
A total of 527 hits were found from DALI search, nonetheless only the first 20 hits that may be of significance were shown on the figure.
Profunc
Related protein sequences
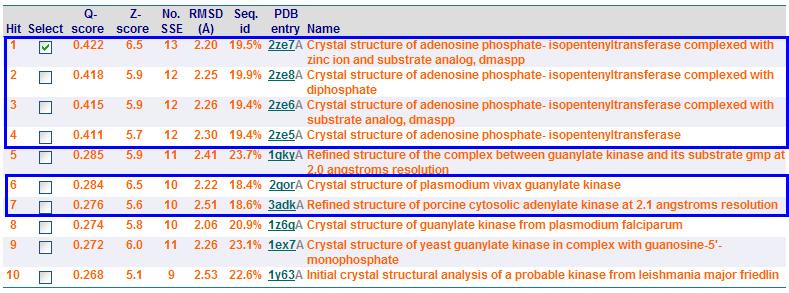
Proteins with similar fold retrived from SSM (Secondary Structure Matching)
From Profunc, similarities of related proteins and proteins with similar fold to query protein were compared with results from DALI. 2qgnA is the query protein highlighted in black in all tables. 2crm, 2crr and 2crq were both found in DALI and Profunc(highlighted in red). On the other hand, 2ze5,2ze6,2ze7 and 2ze8, as well as 3adk and 2qor were also found in DALI output(highlighted in blue).
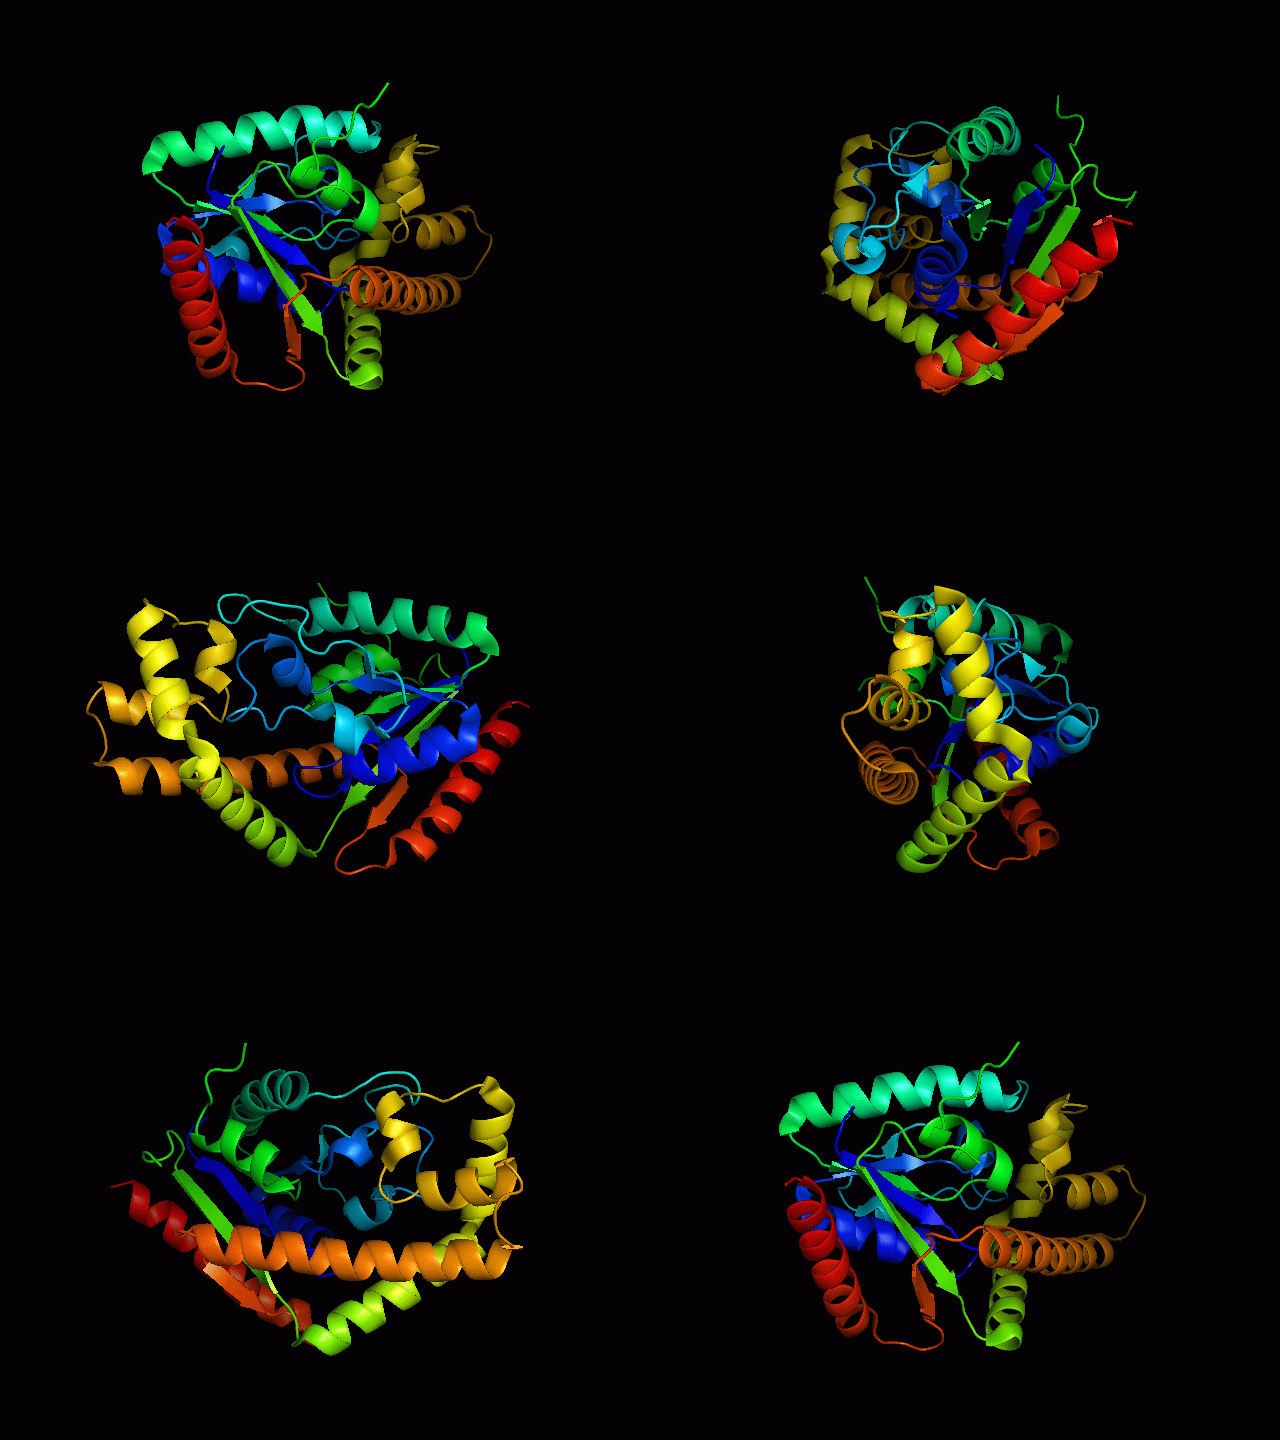
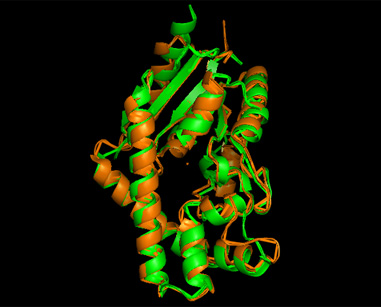
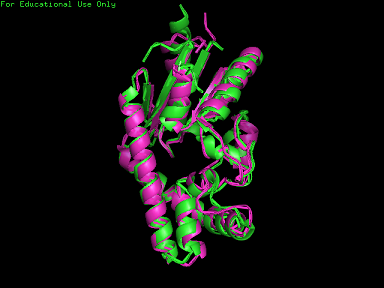
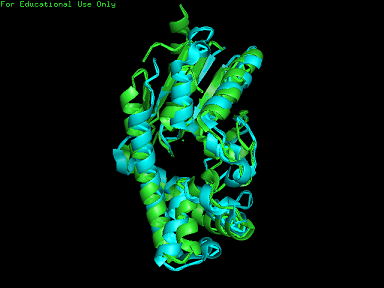
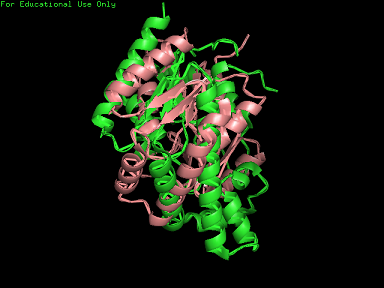
Based on the outcome of DALI and Profunc, PDB files of each structurally similar protein was obtained from PDB. These were each superimposed against 2qgn using the PyMOL software, to compare the structural similiarity. Results are as below :
As indicated by the figures above, each structures were structurally similar to 2qgn, suggesting that they could have functionally similar properties. Nonetheless,notice that 2-qor is only partially similar to 2qgn structure.
As the Z-score decreases for the DALI output, the structural similarity decreases as well. For this reason, functional analysis of 2qgn was only done for DALI outputs with lali scores higher than 200.
Localisation Expression of tRNA isopentenyltransferase
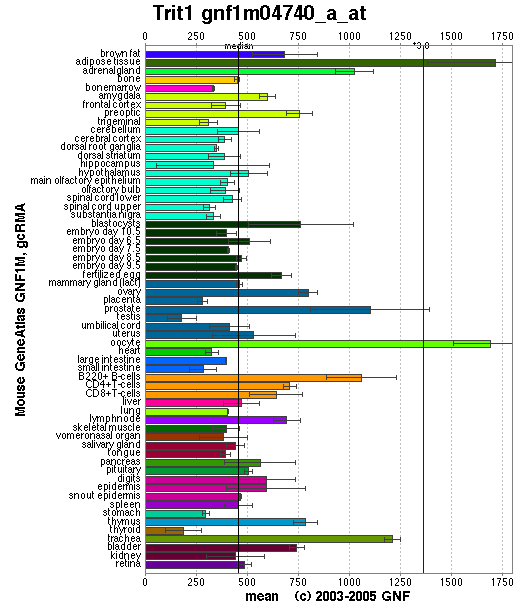
Generally, this enzyme is expressed in all tissue types since it is important that functional protein are synthesized in each of these tissues. Specifically, it is highly expressed in adipose tissues as well as oocytes. Relatively high amounts of this enzyme is expressed in prostate, adrenal gland, B-cells and trachea. The reason why tRNA-IPT are at higher concentrations in these tissues may reflect higher levels of protein synthesis.
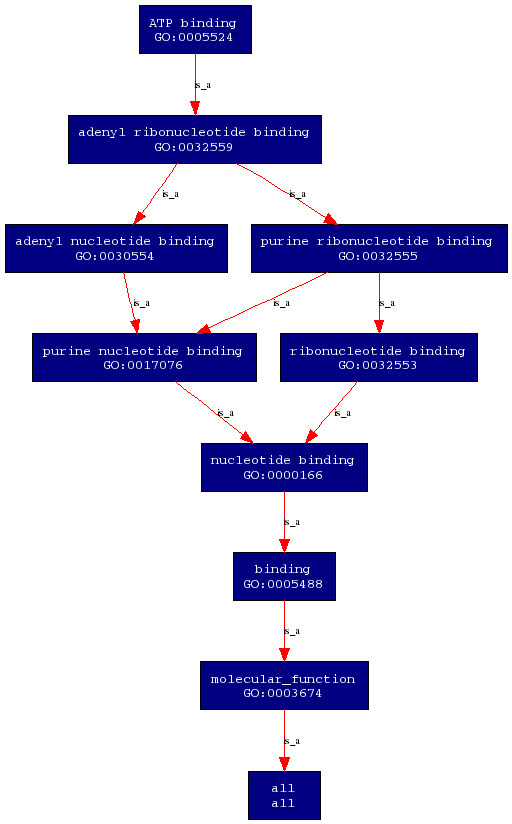
Molecular Function
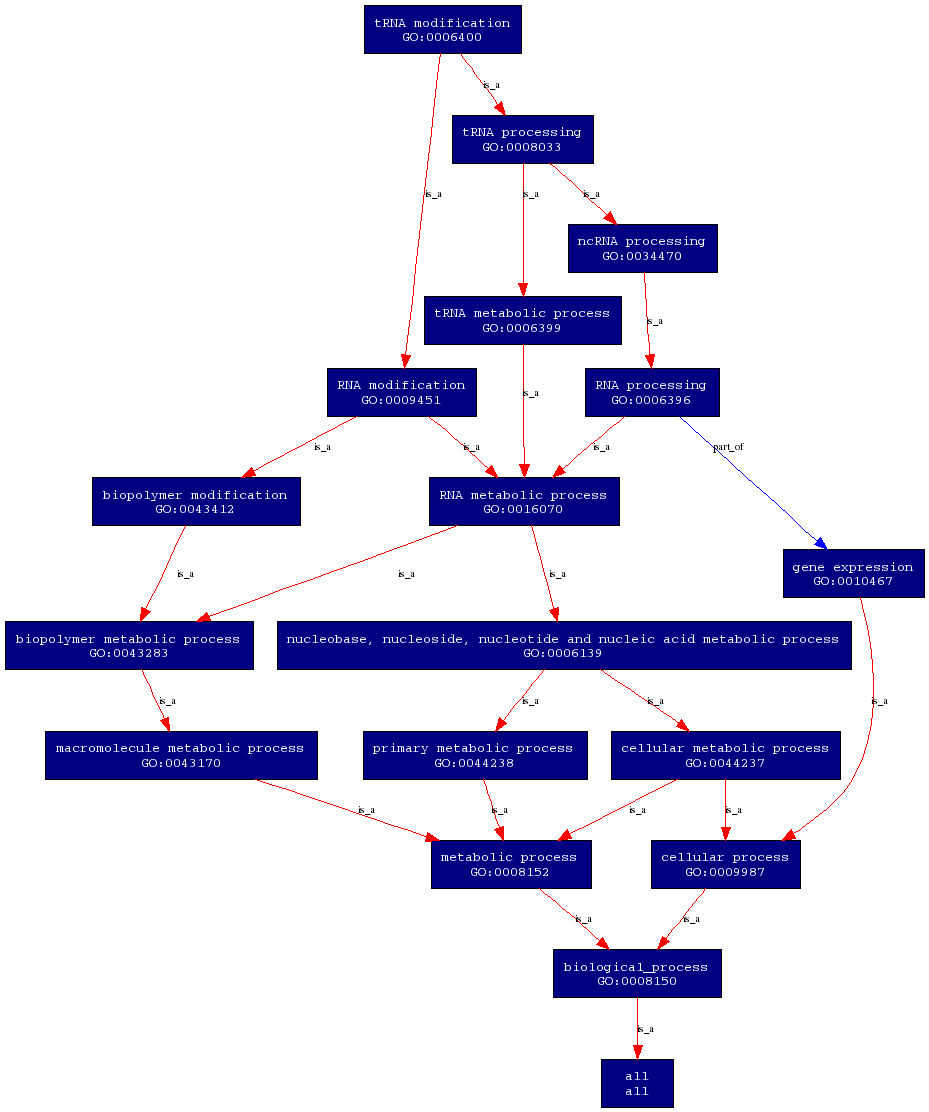
Biological Process
Both the molecular function and biological proceses are obtained from ProKnow.
Annotations for tRNA isopentenyltransferase
The annotations below shows the cellular, biological processes and functional function of the protein in plants. tRNA-IPT was first found in plants and it is a very important hormaone enzyme that affects plant growth and development.
